Historic of the gold spot price in various currencies

According to the currency in which it is observed, we see that the evolution of the price of gold changes dramatically. This article presents the historical chart of gold prices in the following currencies: EUR, USD, GBP, JPY, CHF, INR, CNY.
The price and quotation of gold is changing so depending on the currency in which you look at it. Indeed, the exchange rate and the purchasing power of a currency change dramatically the evolution of pix of gold. We often see that when a currency is devalued, the price of gold tends to skyrocket.
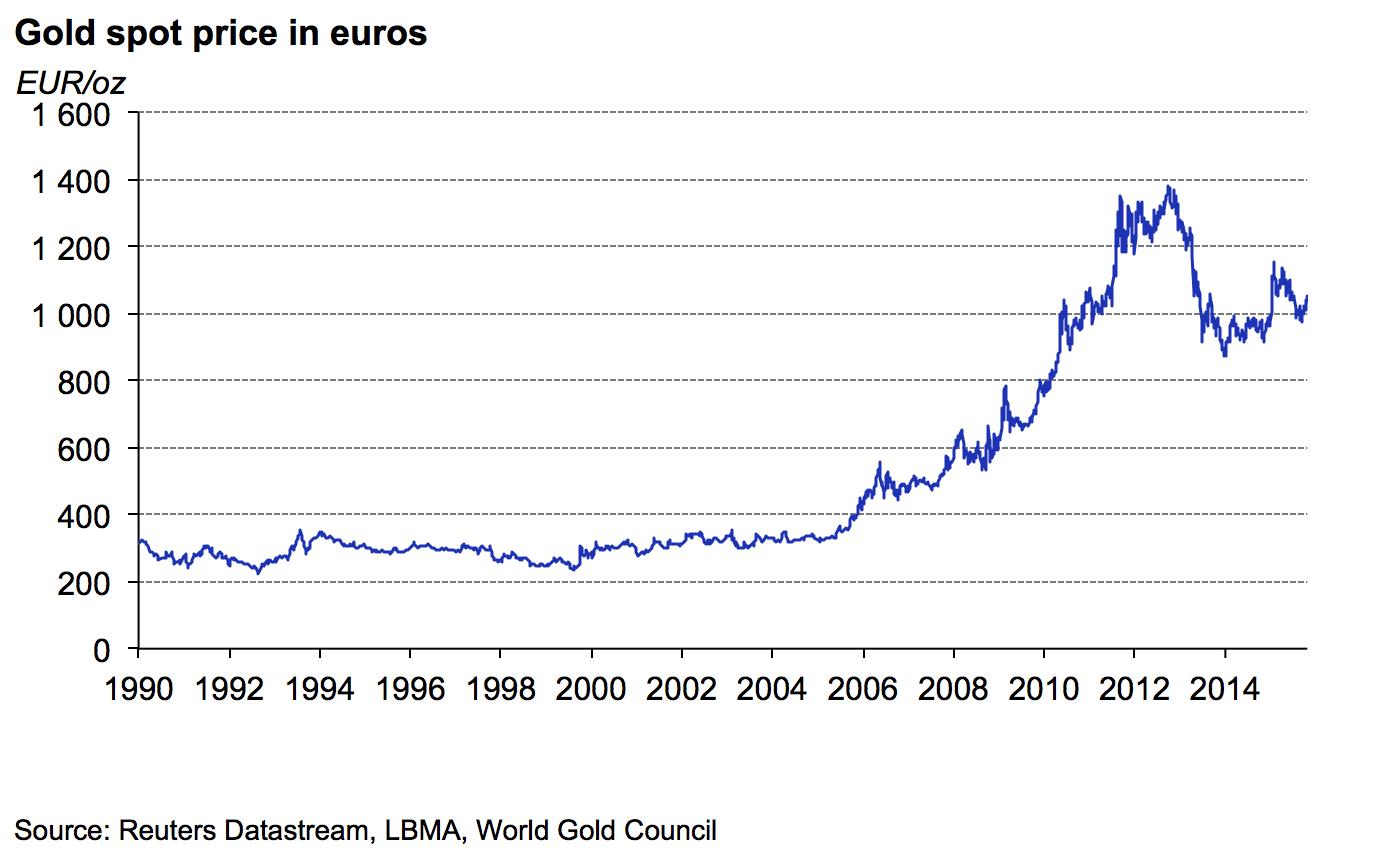
Historical chart of the gold spot in euro (EUR).
The euro is the official currency of the Eurozone.
Looking at the historical chart of the gold price in euro, there is exponential growth course from 2006. From 2006, the price of gold over 10 years significantly increases due the weak dollar, rising oil prices and geopolitical worries.
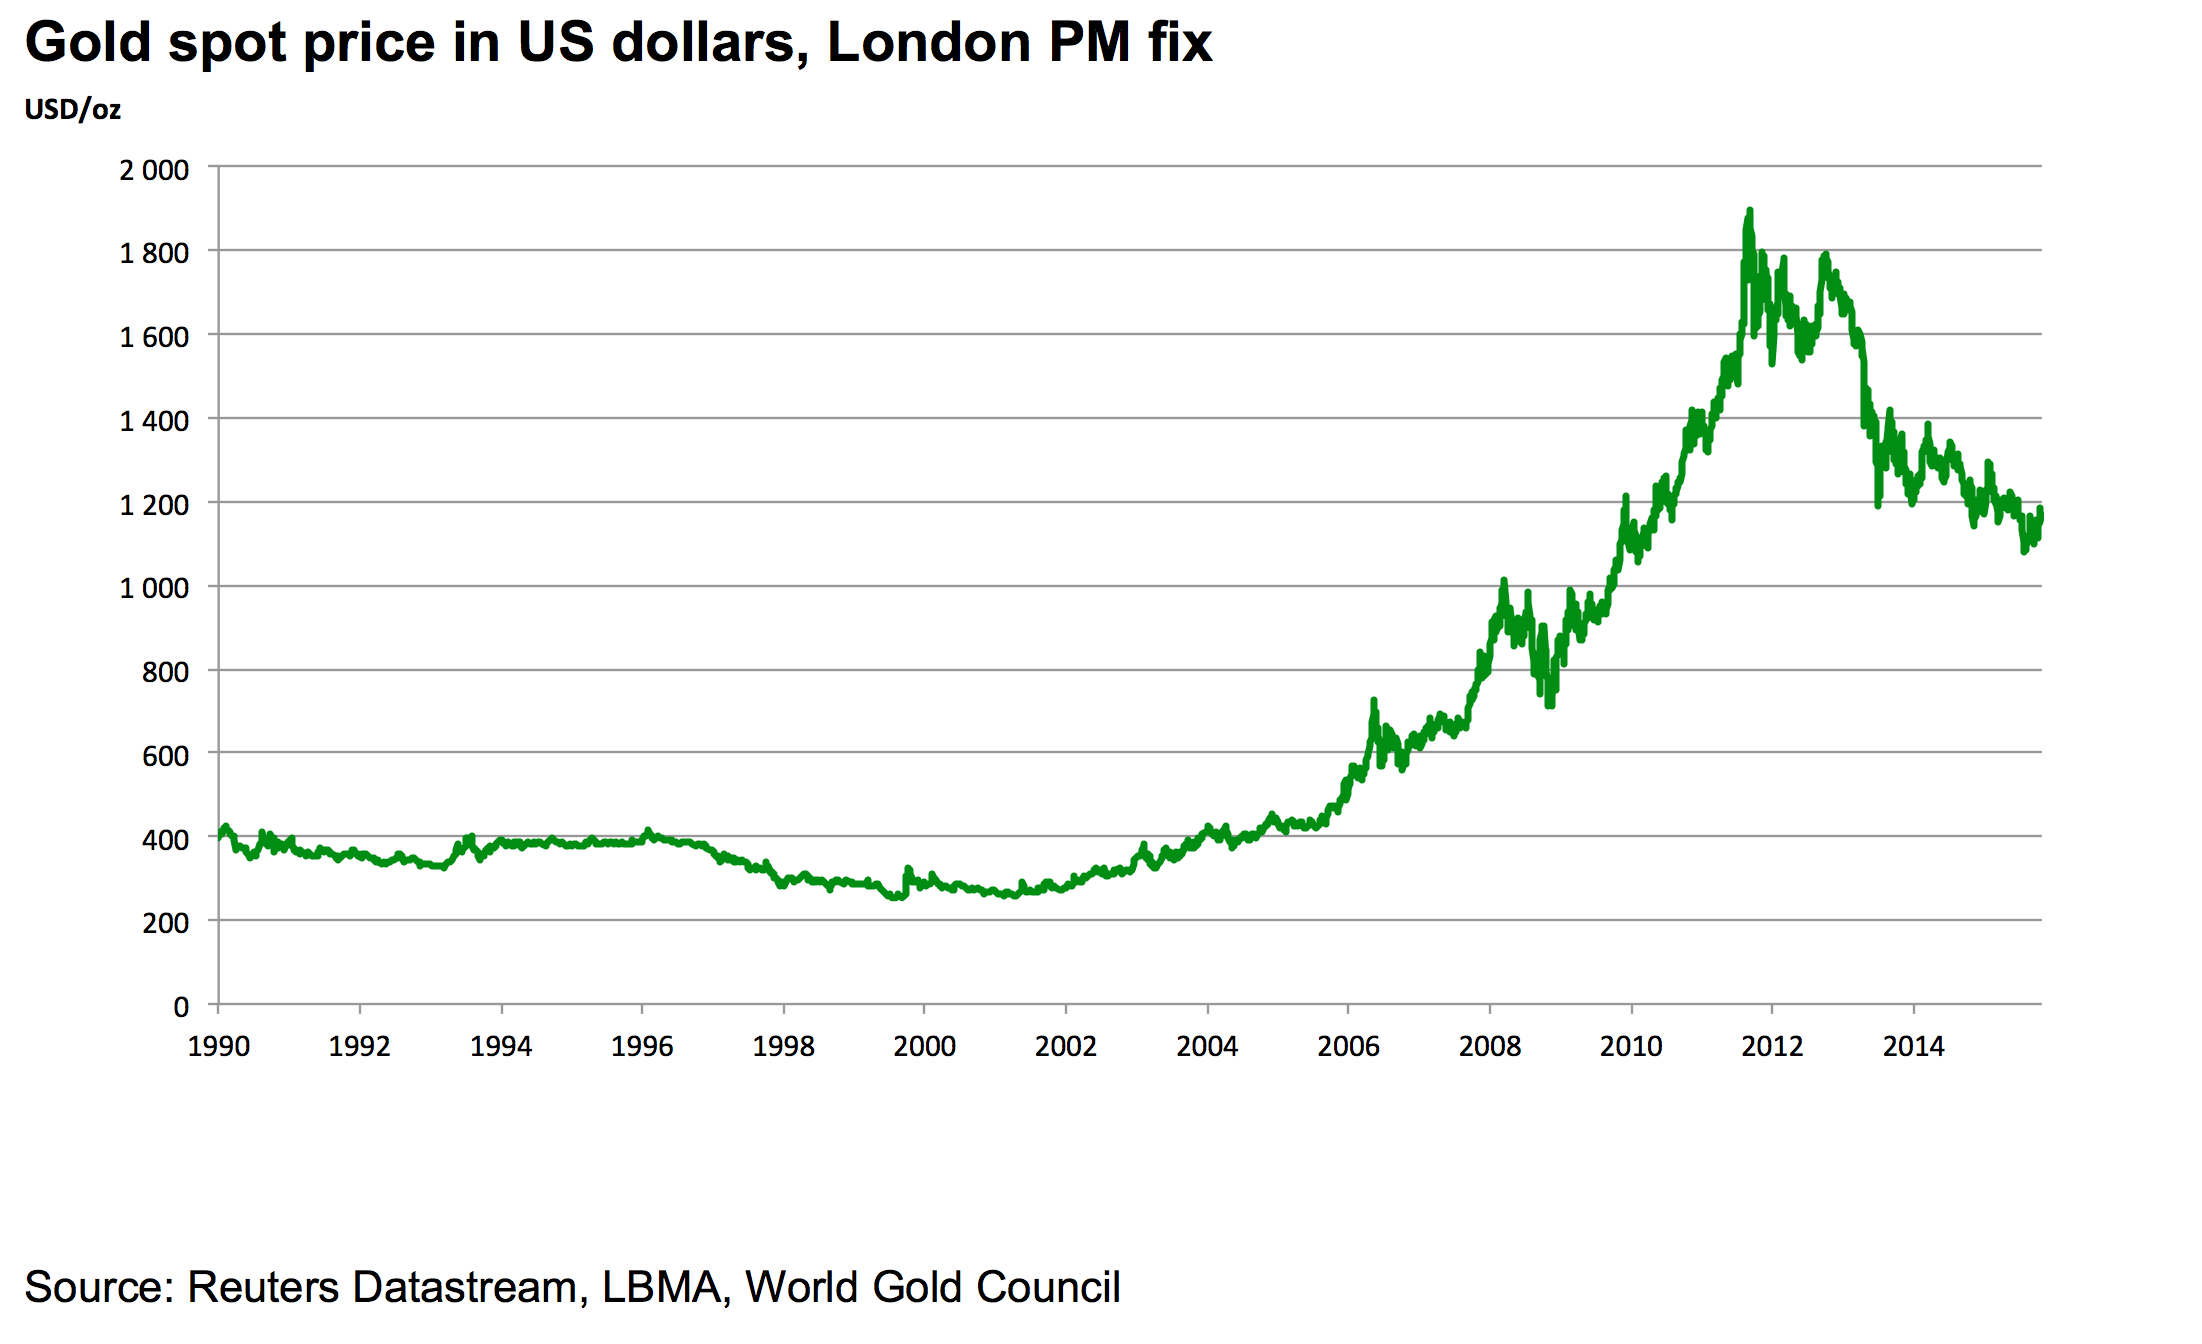
Historical chart of the gold spot in dollar (USD).
The dollar is the most widely used currency in the world and the official currency of the United States.
Looking at the chart of the gold price in dollars, we see that after the increase in 2011 – 2012, the price of gold has fallen and has not rebounded, unlike the price of gold in euros. So we can say that the price of gold in dollars is currently more in a downtrend.
The graph in quotation of gold in dollars shows that the price increase in 2013 was less marked, unlike the graph of the gold price in euro, and 2013 marks its historical peak.
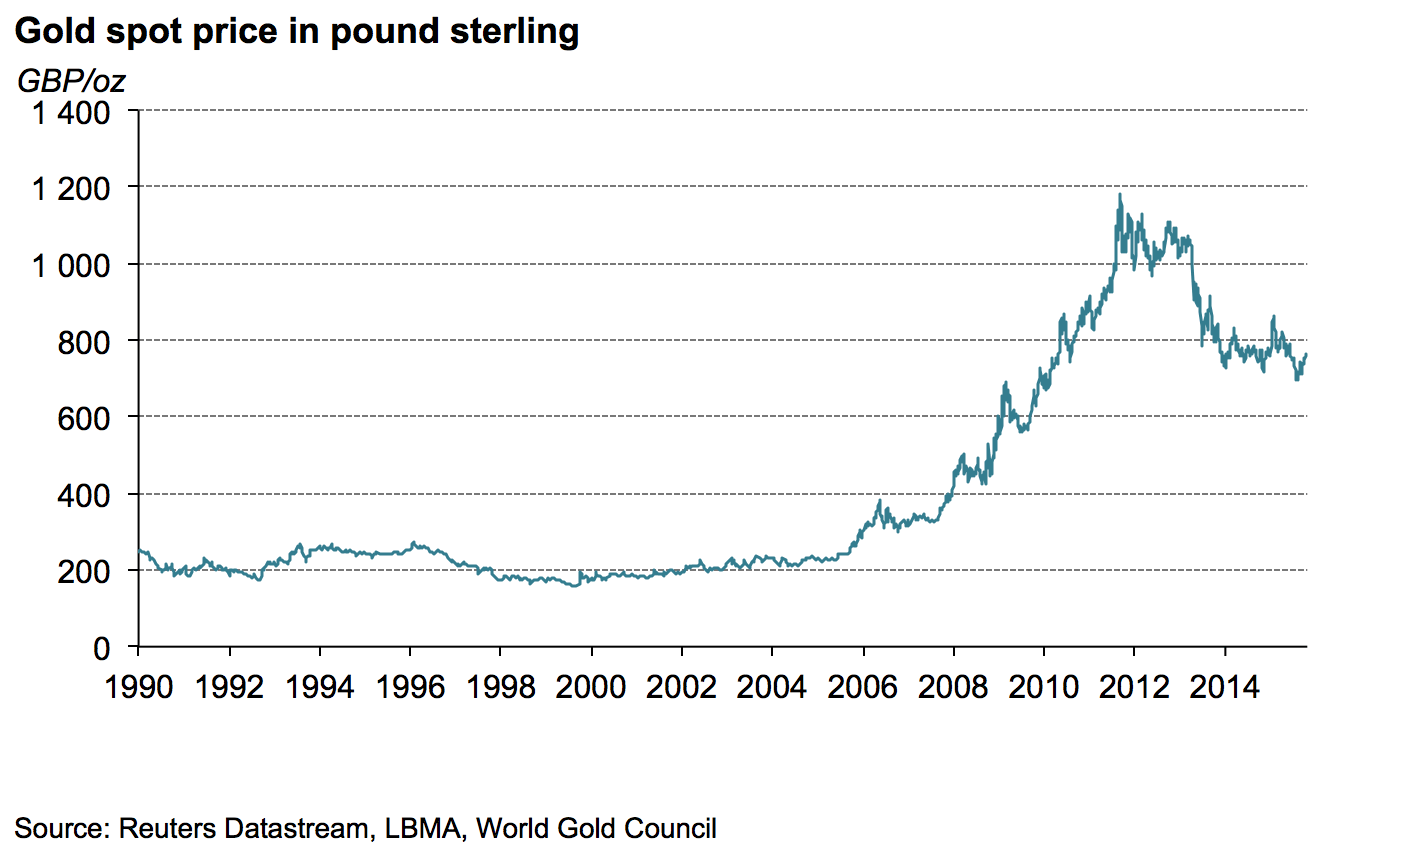
Historical chart of the gold spot in pound sterling (GBP).
The pound sterling is the currency used in the United Kingdom.
The graph of sterling gold price is very similar to the graph of the gold price in dollars.
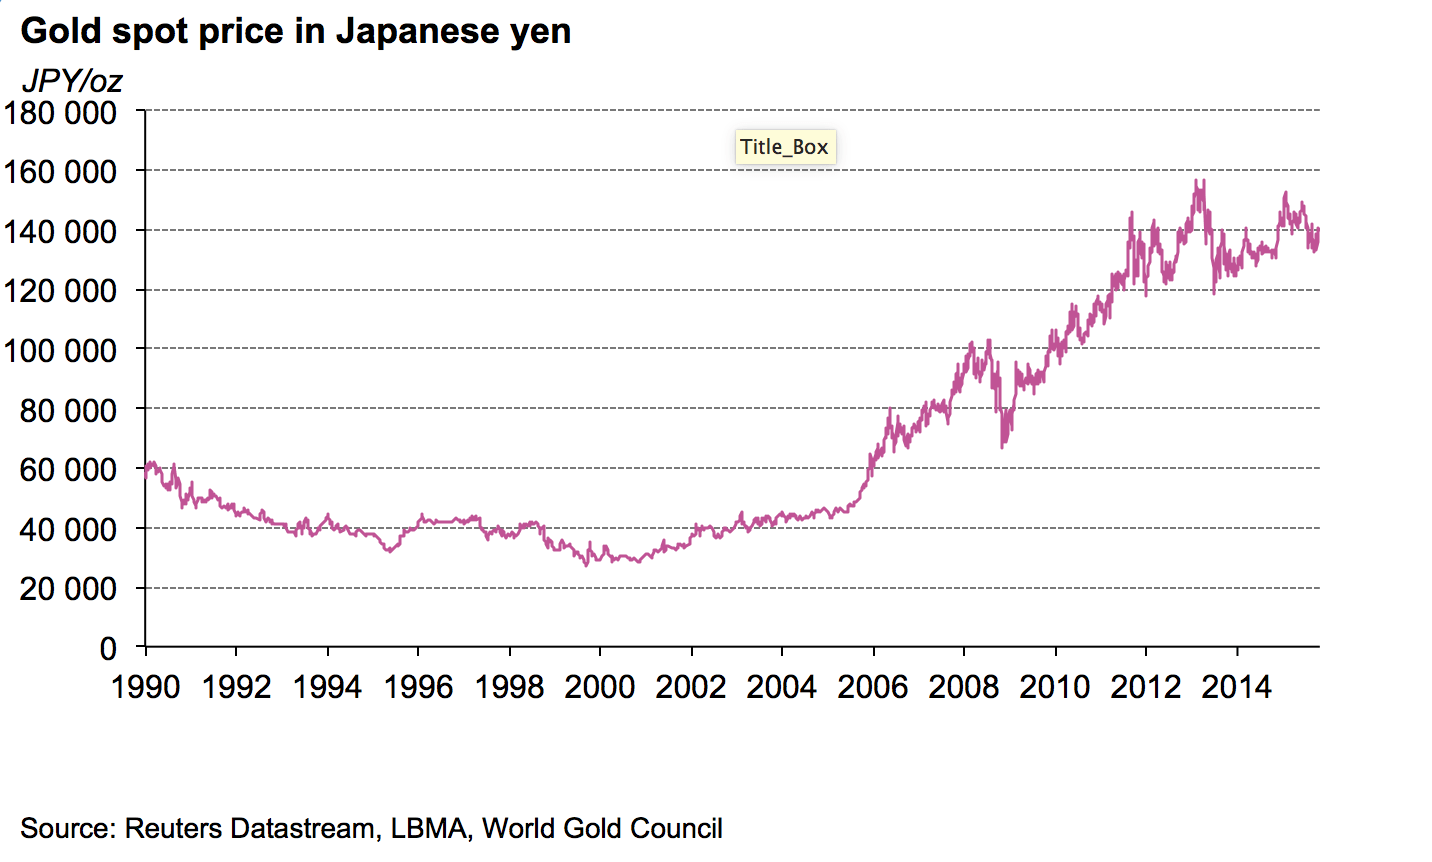
Historical chart of the gold spot in yen (JPY).
The Yen is the currency of Japan.
The evolution of the gold price in yen shows that the price of gold in yen has never declined, and always remained in an uptrend. However in the early 1990s, we see that the price of gold in yen fell more than other currencies, its price beginning from 60,000 yen / oz less than 40,000 yen / oz in 1995, a decrease more than 35%.
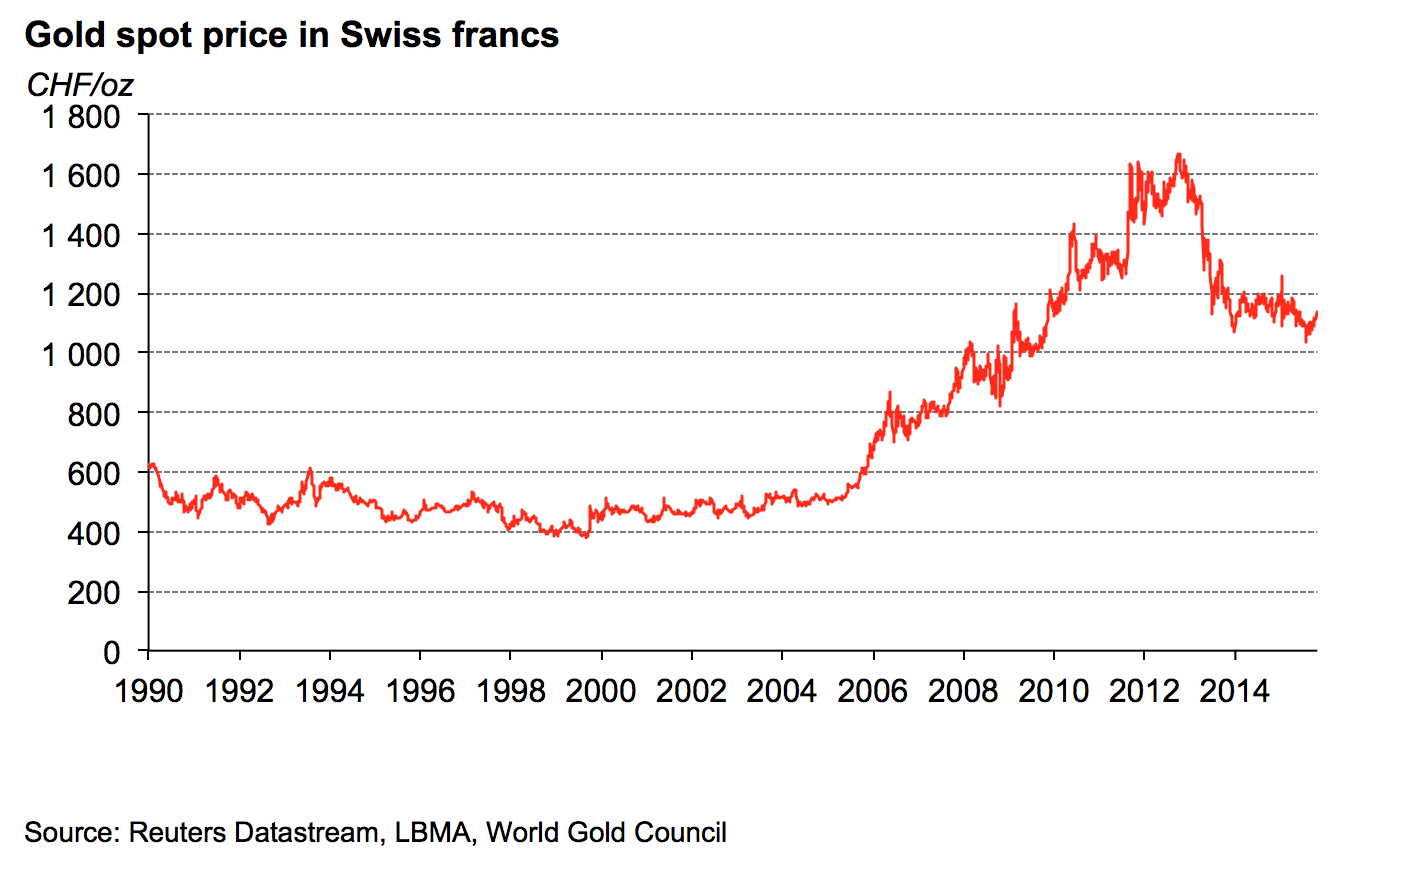
Historical chart of the gold spot in Swiss Francs (CHF).
The Swiss Franc is the currency in Switzerland.
By observing the history of the gold price in Swiss francs, we can see that gold francs in Switzerland was much more volatile from 1990 to 2000. Unlike other currencies, in which the price of gold was very flat the price of gold over 10 years in Swiss Francs was very nervous and was moving a lot.
You can see on the chart including the gold price in Swiss francs over the sudden rise of late 1992, early 1993, which followed a sharp decline in the course.
Historical chart of the gold spot in indian rupees (INR).
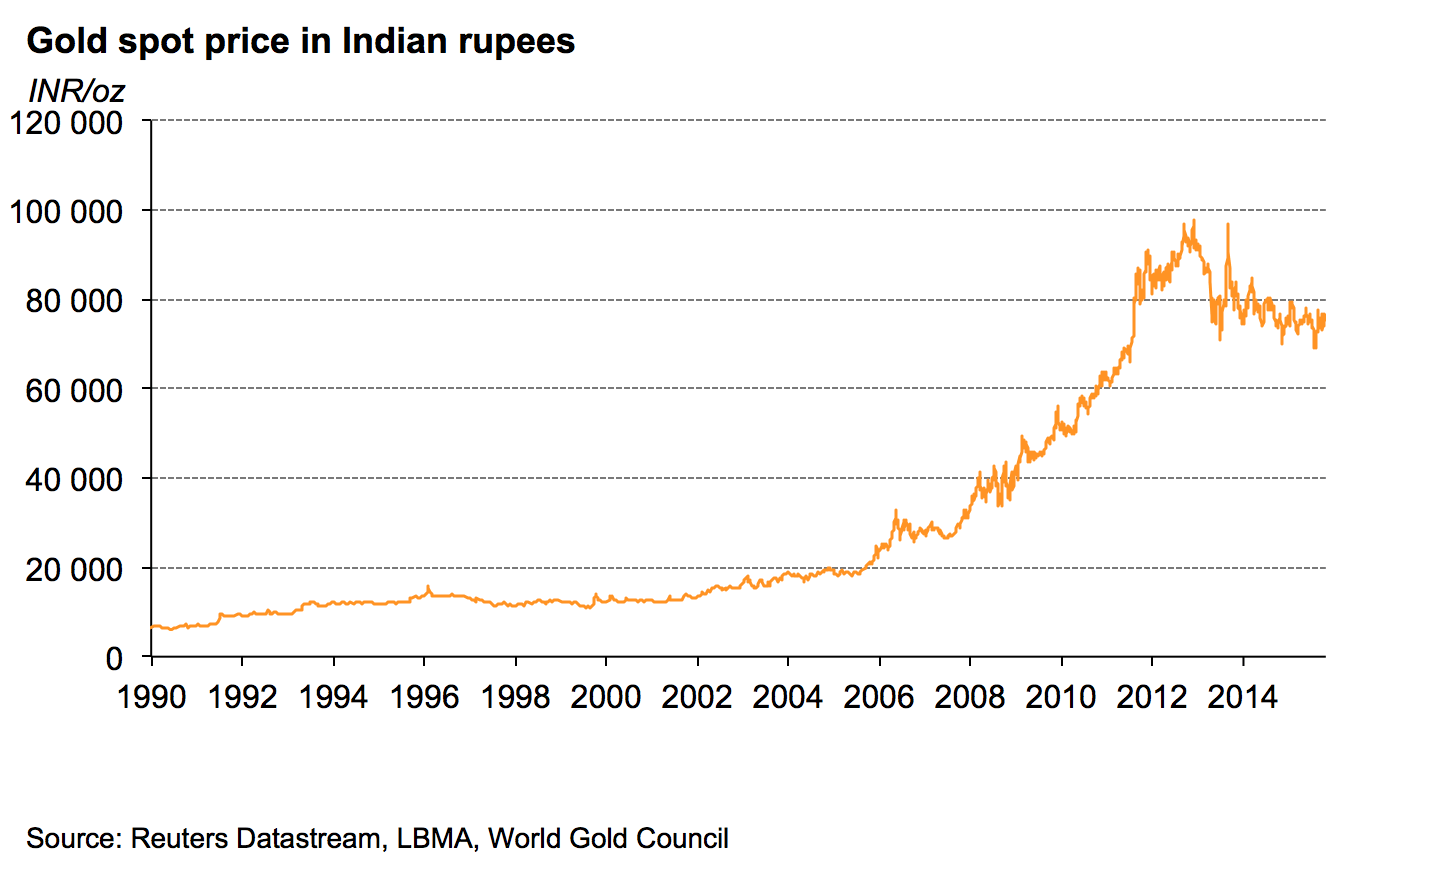
The Indian rupee is the currency and official currency of India.
The chart of gold prices in Indian rupee shows us that the course has experienced high volatility in 2013, due mainly to the depreciation of the rupee in August 2013.
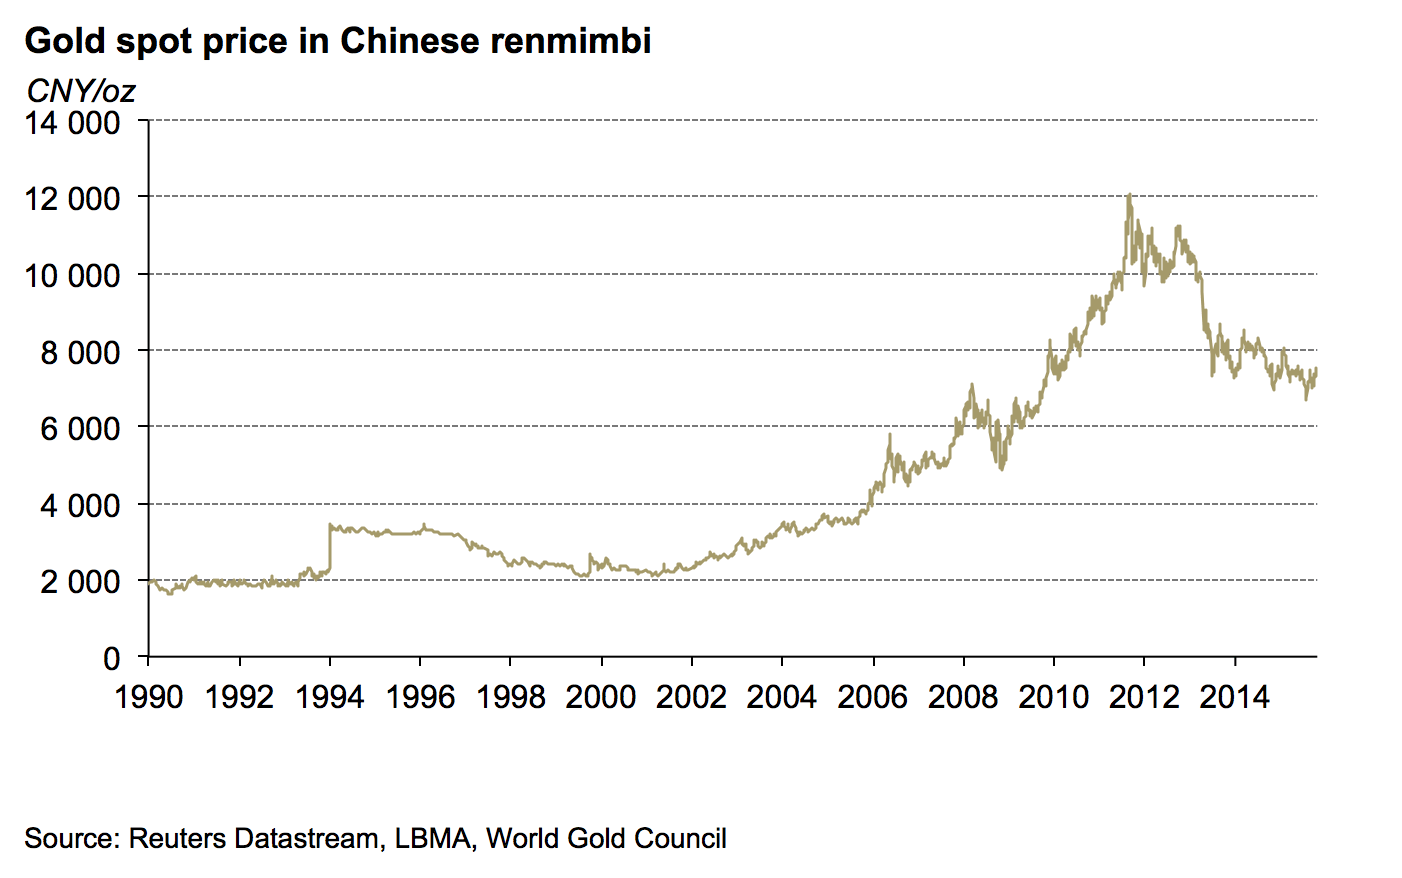
Historical chart of the gold price in chinese renmimbi (CNY).
The renminbi is the currency in China.
The chart of gold prices in Renminbi shows an evolution of gold prices. We see in 1994 a sharp rise in gold prices. This fact, observable on the graph above is due to the introduction of a new system for the exchange rate of the Renminbi. He was at once devalued by 33%, making brutally raising the price of gold.
Sources : World Gold Council
