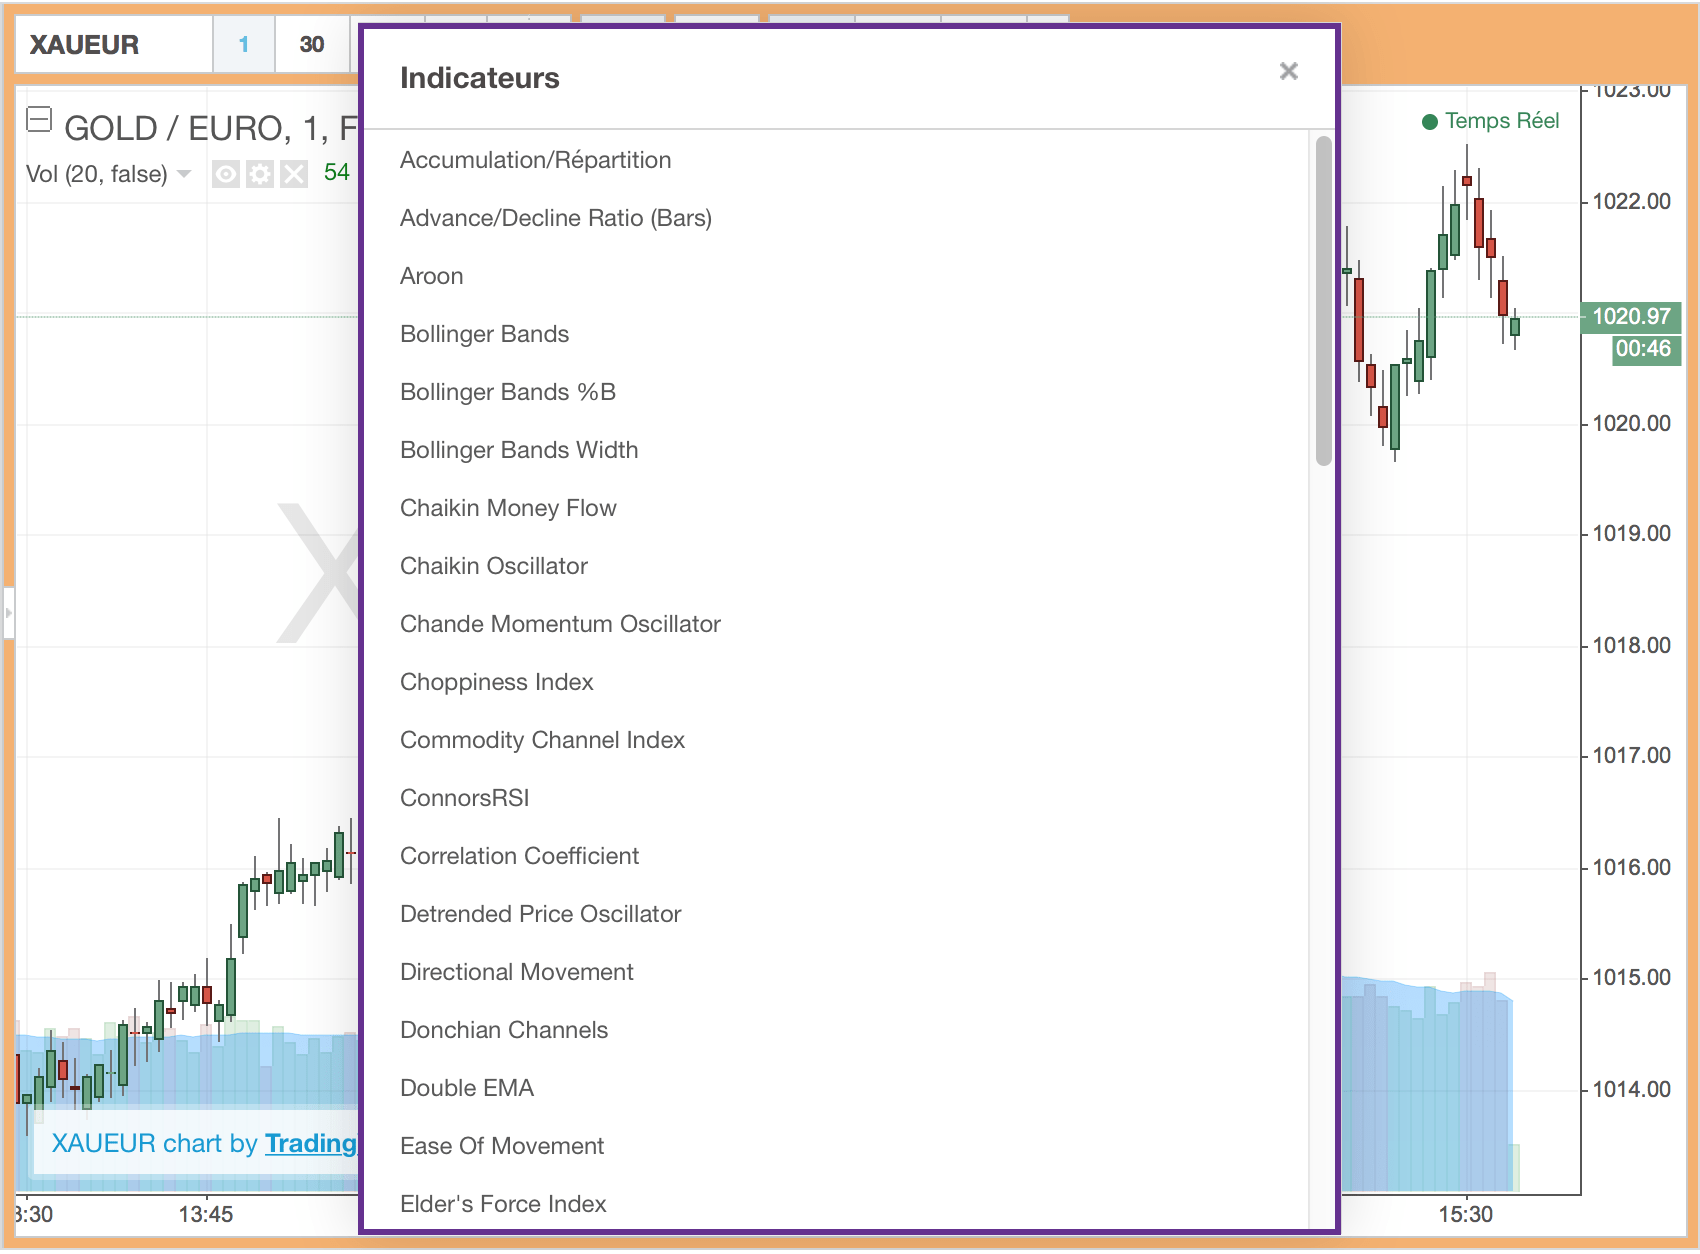
A small tutorial on how to read the graph of the gold spot price per ounce (oz) and kilo (kg) in real time providing Orobel. We provide advice to understand the different elements of the chart during the live gold and follow a simple way of trading in gold XAU.
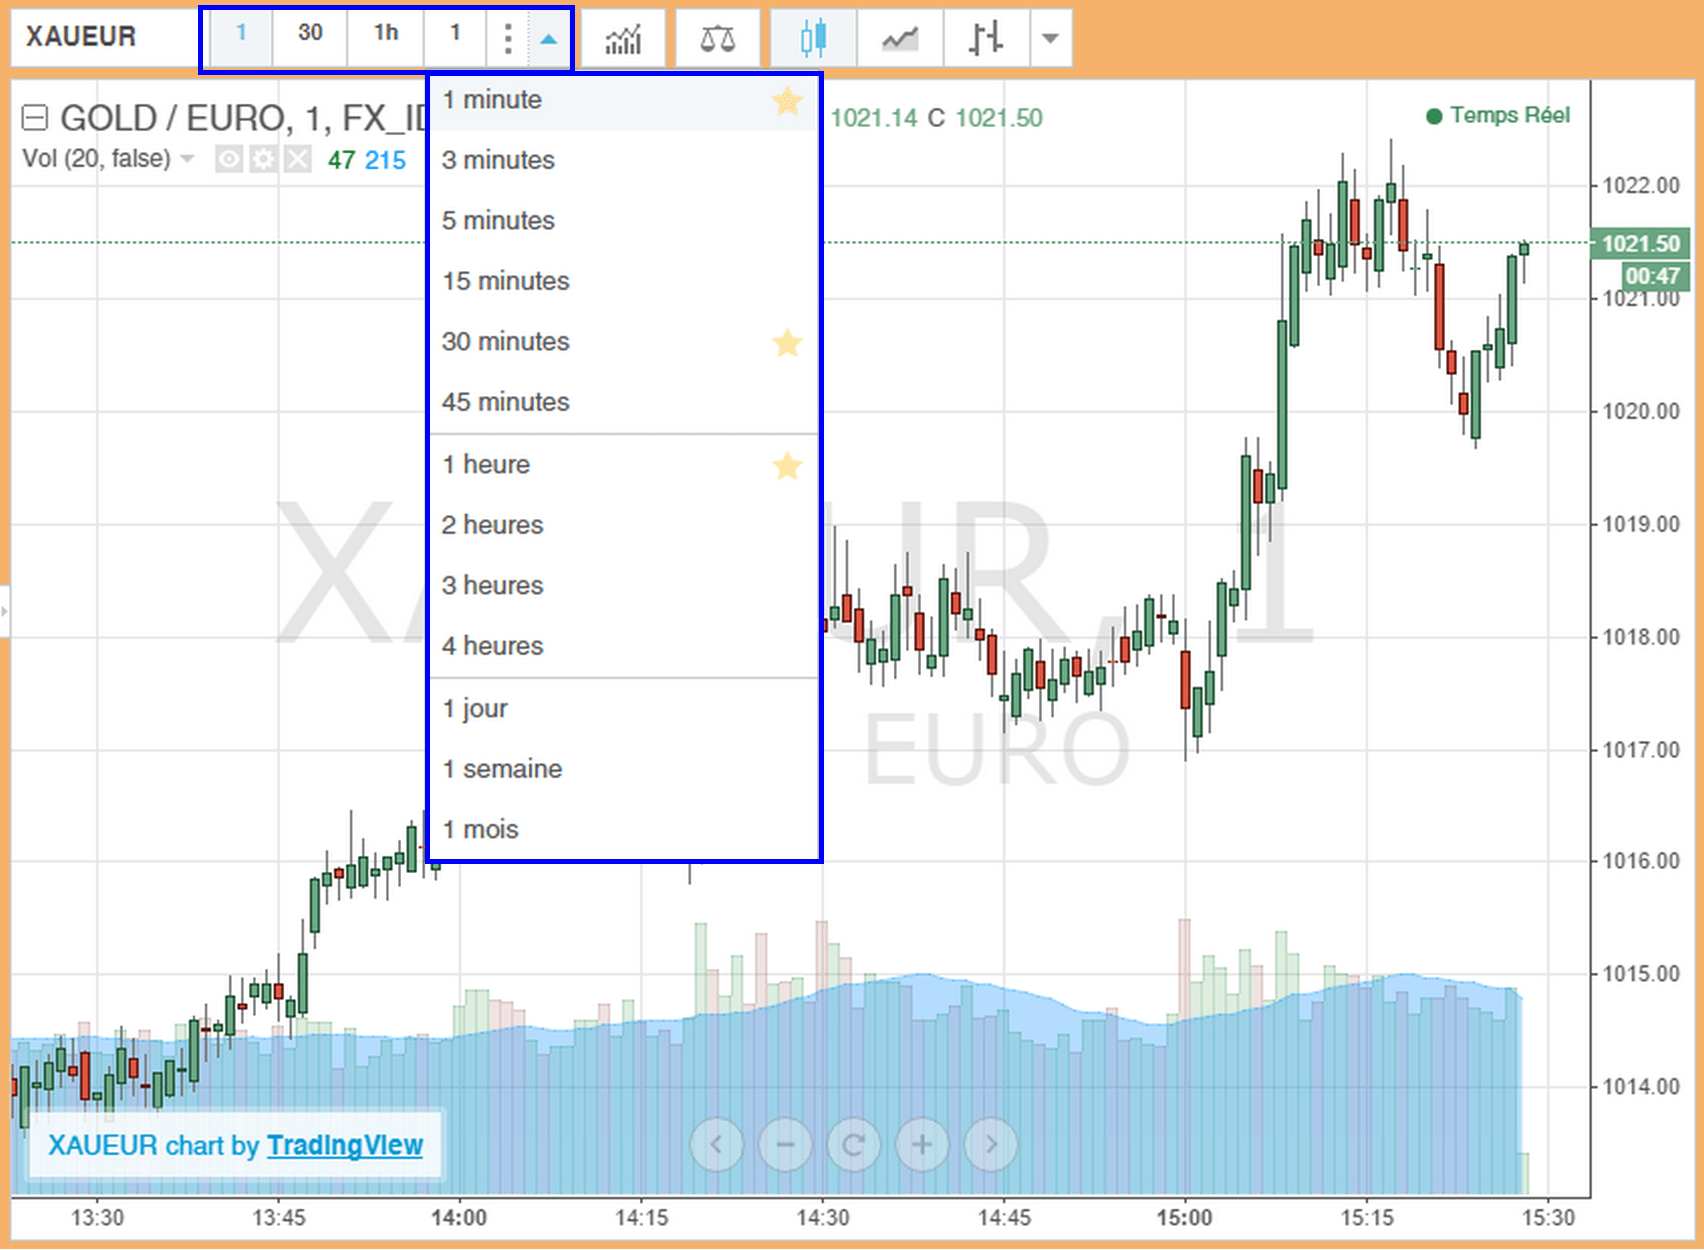
Time Scale chosen to view gold spot price XAU.
There are 3 main categories of time scale to view graph of live gold spot price.
- Short time scale : 1min, 3min, 5min, 15min, 30min, 45min.
Practical to see nervousness and volatility of the gold market. We recommend in particular to view the graph in 1 min and 3 min time scale.
- Average time scale : one hour, two hours, three hours, four hours.
Useful to see the trend of one ounce (oz) gold price at medium term.
- Long time scale : 1 day, 1 week, 1 month.`
Allow to have a more global vision and long-term history of gold prices.
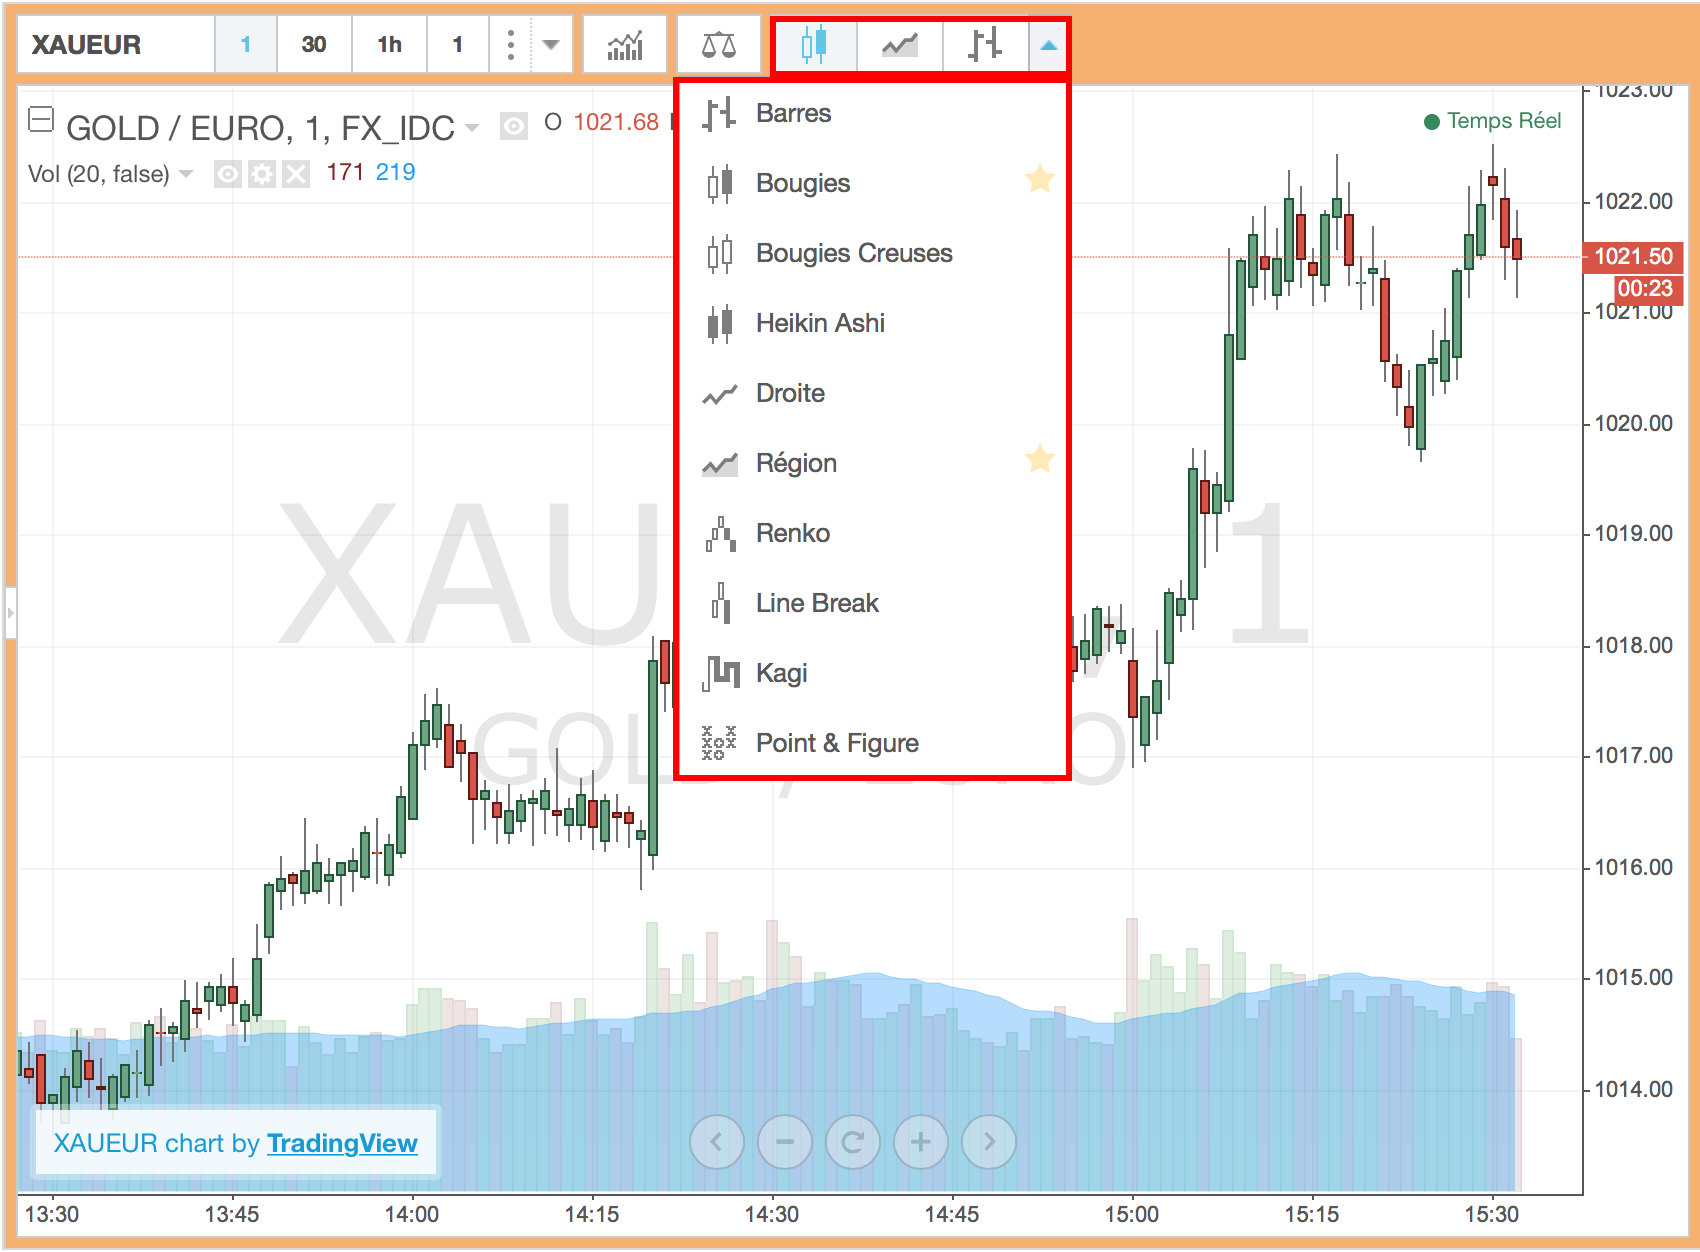
Graph display style gold prices in real time XAUEUR.
Our graphs of price per ounce and kilo of gold can be viewed in different forms.
- Japanese Candlestick (candle with full or hollow): recommended as very relevant.
- Bar Chart (or bar graph): recommended because provide a lot of informations.
- Line Graph (Right): recommended for very readable.
- Renko
- line Break
- Kagi
- Point Figure
The charts of gold prices in Renko, Line Break, Kagi and Point figures are little used and we do not recommend them because they make it difficult to read graphics.
We recommend reading gold prices chart in realtime Japanese Candlestick including the relevance and the information they provide.
Explanation of Candlestick.
Let’s take an example. You view the graph by choosing a time scale unit of 5 min. A Japanese candlestick represents 5min of gold price quotation.
- When the candlestick is green, the closing price is higher than the opening price. Gold price rises.
- When the candlestick is red, the closing price is lower than the opening price. Gold price goes down.

In a Japanese candlestick, one distinguishes the body of the candlestick (red or green), and the candlestick wick (Ranging from highest to lowest).
Japanese candlesticks are very relevant because they really show the volatility and nervousness of the market.
- When the wick of the candlestick is big, the market is nervous and very volatile. The price of gold fast moving upwards or downwards.
- When the wick of the candle is small, the market is flat and the course is stagnating. The price of gold moves very little.
We dedicate a detailed article soon on the study of Japanese candlesticks on the gold price.
Technical analysis tools for gold spot price in realtime.
The gold prices chart in real time provided by Orobel offer you over 50 technical analysis tools. Among them, in particular include :
- Bollinger Bands
- MACD
- Moving Averages
- Stochatisc
- Volume
- Williams% R
And many other technical indicators. We will devote a more detailed article soon learn to understand and use the main technical indicators on the price of gold in real time.
Read gold price chart in realtime XAU.
The graph below XAUEUR representing the price of gold in real-time in euro currency. The informations displayed are :
- Abscissa, you can watch the time.
- Ordinate, the price of an ounce of gold or gold kilo.
Top of the chart, one can see different figures joined to letters:
- O for Open : shows the opening price.
- H for High-Indicates : the highest price achieved on the observed time unit.
- B, for more Down : indicates lowest price reached on the observed time unit.
- C for Closing : indicates the closing price.
The histogram represents the volumes traded. When the histogram is green, it comes to purchase volumes, when red, it comes to sales volumes. The blue area represents the average trading volumes.
