Through this article, you will know how to read and understand Japanese candlesticks on the gold spot price chart in real time.
What is japanese candlestick ?
Little historic reminder
The Japanese candlestick charts are highly relevant to analyze commodity prices, especially gold. Indeed in 1600, the Japanese used them to analyze the price of rice. They were then popularized by Steve nisson.
Japanese candlesticks are a method and a graphical display style of the gold price.
Unlike the linear graph that it provides only one information (Gold’s closing price), Japanese candlesticks provide 4 informations : opening price, closing price, highest and lowest.
A Japanese candlestick may represent 5min, 10min, 30min, 1h, 1 day of gold quote (According to the selected unit).
How to read a japanese candlestick on the gold price ?
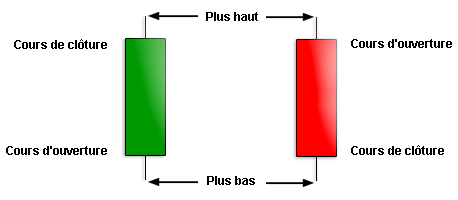
A Japanese candlestick is constitued of a body and a shadow.
The image below explains how to form a Japanese candlestick.
Candlestick’s body.
The body of the candlestick represents the interval between the opening price and the closing price. It can be of two colors, and can refer to two different things.
- Bullish Candlestick : green
Here, the closing price is higher than the opening price = the price rises.
- Bearish Candlestick : red
The closing price is below the opening price = the price drops.
Two important things to know according to the body of the candlesticks.
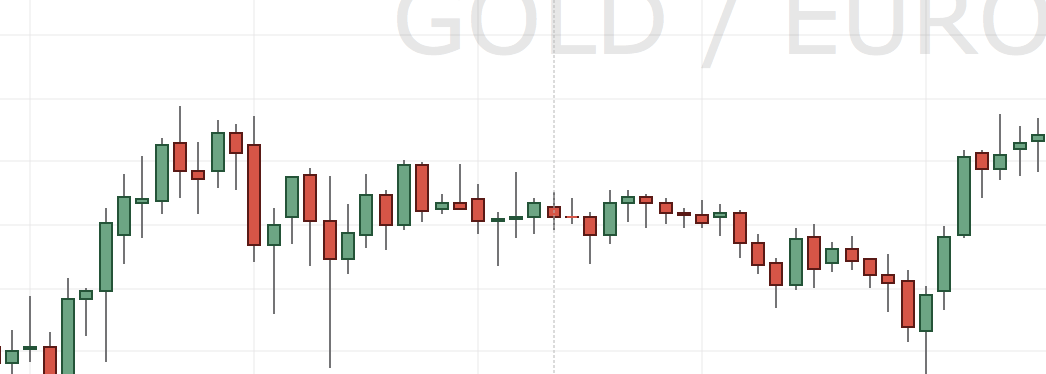
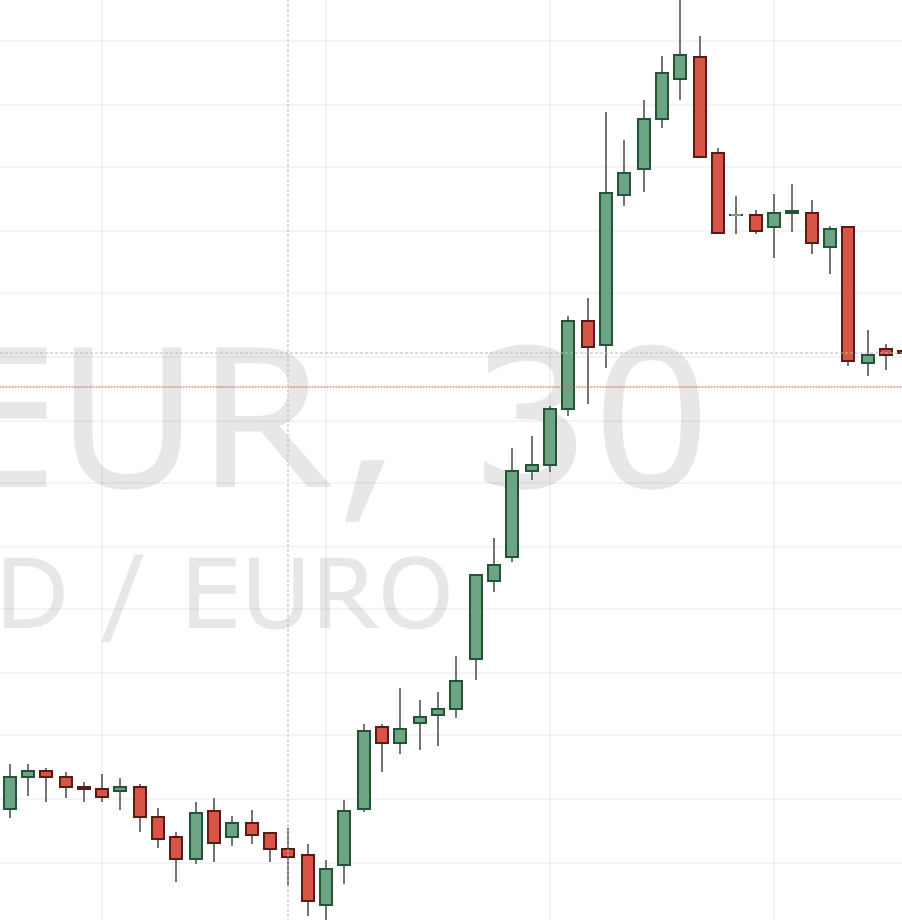
As you may have realized, the body of a candlestick maybe small or large. A picture is better than a speech.
[columns grid=”yes|no” ]
[column_item col=”4″]
A little body mean a weak evolution of the gold price.
[/column_item]
[column_item col=”4″]
A large boy asin the picture means a strong evolution of current trend in the gold price.
[/column_item]
[/columns]
The shadow.
The shadows of the Japanese candlesticks determine the highest and lowest that the price reached during the defined time unit.
They are very important because they provide highly relevant and easily usable information. They reflect the volatility and nervousness in the gold market.
Japanese candlesticks are very relevant because they really show the volatility and nervousness in the market.
[columns grid=”yes|no” ]
[column_item col=”6″]
When the shadow of the candlestick is large, market is really nervous and volatile.
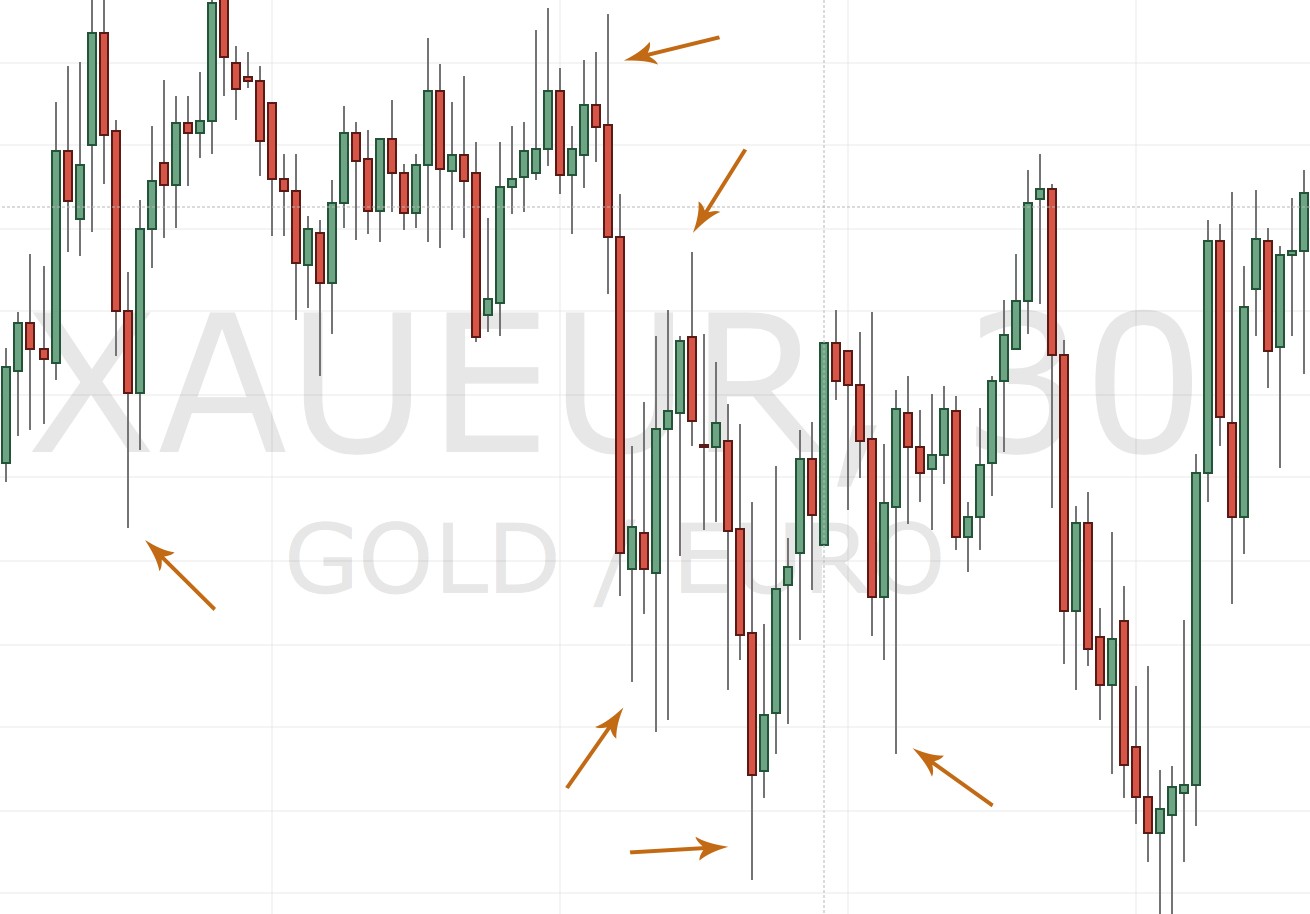
The gold price progress upward really faster.
[/column_item]
[column_item col=”6″]
When the shadow is small, market is flat and the gold price stagnate.
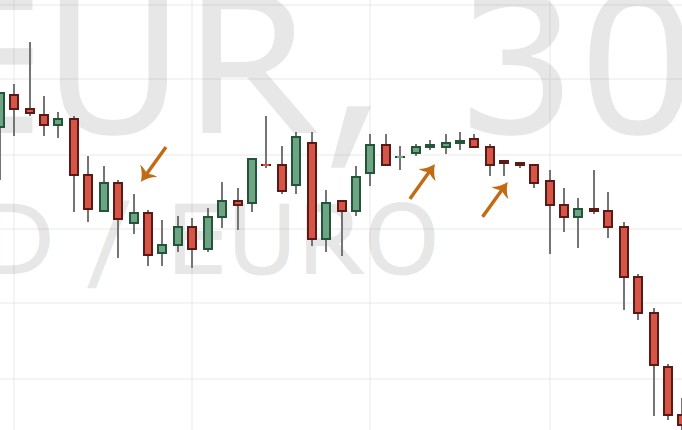
The gold price doesn’t move a lot.
[/column_item]
[/columns]
Candlesticks form these valuable guidance when coupled with indicators of trend changes. We will see later some configurations to see how the gold price evolve and anticipate some changes in the gold price.
Warning : Japanese candlesticks are only decisions making tools and are in no way related to rigid rules.
